Quick answer
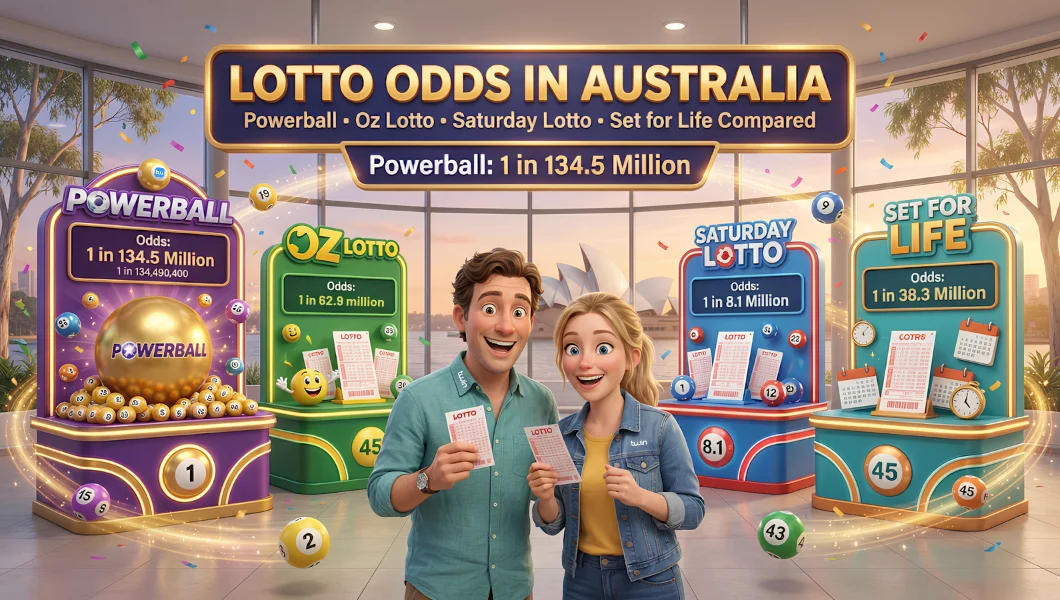
Of Australia’s main lotteries, Saturday Lotto has the best Division 1 odds at about 1 in 8.1 million per game. Set for Life is next at about 1 in 38.3 million, then Oz Lotto at about 1 in 62.9 million. Powerball has the longest odds at about 1 in 134.5 million, which is why its jackpots grow so large. For any prize at all, Powerball is the easiest at about 1 in 44 per game.
What you'll learn
- How each Australian lotto game is drawn
- The odds of every prize division in Powerball, Oz Lotto, Saturday Lotto and Set for Life
- Which lotto has the best odds, and why it depends on what you want
- How systems and extra games change your chances
- How to work out your own odds with our free calculator
Lotto odds are often quoted, but rarely explained. Each game draws a different amount of numbers from a different pool, and that changes the odds dramatically. This guide sets out the odds for every division of the main Australian games side by side, so you can see exactly what each ticket offers. All odds are per standard game, calculated from each game’s number matrix.
How the main Australian lotto games work
| Game | How it’s drawn | Prize divisions | Draw |
|---|---|---|---|
| Powerball | 7 numbers from 1 to 35, plus 1 Powerball from a separate barrel of 1 to 20 | 9 | Thursday |
| Oz Lotto | 7 numbers from 1 to 47, plus 3 supplementary numbers | 7 | Tuesday |
| Saturday Lotto (Gold Lotto in Queensland, X Lotto in SA) | 6 numbers from 1 to 45, plus 2 supplementary numbers | 6 | Saturday |
| Set for Life | 7 numbers from 1 to 44, plus 2 bonus numbers. Division 1 pays $20,000 a month for 20 years | 8 | Every night |
All four games are run by The Lottery Corporation under The Lott brand (Lotterywest in Western Australia sells the same national games). Prize amounts change every draw, because most divisions share a pool between the winners.
Which lotto has the best odds?
| Game | Division 1 odds per game | Odds of any prize per game |
|---|---|---|
| Saturday Lotto | 1 in 8,145,060 | 1 in 85 |
| Set for Life | 1 in 38,320,568 | 1 in 50 |
| Oz Lotto | 1 in 62,891,499 | 1 in 50 |
| Powerball | 1 in 134,490,400 | 1 in 44 |
So the answer depends on what you mean by “best”. Saturday Lotto gives the best chance of the top prize, but its jackpots are usually much smaller. Powerball gives the best chance of winning something, mostly small Division 8 and 9 prizes, but the worst chance of the jackpot. Set for Life sits in between and pays its top prize as a monthly income instead of a lump sum.
Putting 1 in 134 million in perspective
If you played one Powerball game every week, you’d expect to wait about 2.6 million years, on average, for a Division 1 win. Even 50 games a week would mean an average wait of more than 50,000 years. Buying a ticket for the dream is fine, but it’s worth knowing how long the odds really are.
Powerball odds by division
Powerball draws 7 main numbers from 35, then 1 Powerball from 20. The Powerball is what makes Division 1 so hard: you need all 7 main numbers and the Powerball.
| Division | Winning numbers | Odds per game |
|---|---|---|
| 1 | 7 + Powerball | 1 in 134,490,400 |
| 2 | 7 | 1 in 7,078,443 |
| 3 | 6 + Powerball | 1 in 686,176 |
| 4 | 6 | 1 in 36,115 |
| 5 | 5 + Powerball | 1 in 16,943 |
| 6 | 4 + Powerball | 1 in 1,173 |
| 7 | 5 | 1 in 892 |
| 8 | 3 + Powerball | 1 in 188 |
| 9 | 2 + Powerball | 1 in 65 |
| Any prize | 1 in 44 |
Australia’s biggest Powerball jackpot was $200 million, drawn on 1 February 2024.
Oz Lotto odds by division
| Division | Winning numbers | Odds per game |
|---|---|---|
| 1 | 7 | 1 in 62,891,499 |
| 2 | 6 + 1 supplementary | 1 in 2,994,833 |
| 3 | 6 | 1 in 242,824 |
| 4 | 5 + 1 supplementary | 1 in 26,271 |
| 5 | 5 | 1 in 4,497 |
| 6 | 4 | 1 in 182 |
| 7 | 3 + 1 supplementary | 1 in 71 |
| Any prize | 1 in 50 |
Saturday Lotto odds by division
Saturday Lotto uses the classic 6 from 45 format with 2 supplementary numbers. The same matrix is used for Monday and Wednesday Lotto, so these odds apply to those draws too.
| Division | Winning numbers | Odds per game |
|---|---|---|
| 1 | 6 | 1 in 8,145,060 |
| 2 | 5 + 1 supplementary | 1 in 678,755 |
| 3 | 5 | 1 in 36,690 |
| 4 | 4 | 1 in 733 |
| 5 | 3 + 1 supplementary | 1 in 298 |
| 6 | 1 or 2 + both supplementaries | 1 in 144 |
| Any prize | 1 in 85 |
Set for Life odds by division
Set for Life draws 7 winning numbers and 2 bonus numbers from 44 every night. Division 1 pays $20,000 a month for 20 years, and Division 2 pays $5,000 a month for a year. A single entry covers seven consecutive daily draws.
| Division | Winning numbers | Odds per game |
|---|---|---|
| 1 | 7 | 1 in 38,320,568 |
| 2 | 6 + 1 bonus | 1 in 2,737,183 |
| 3 | 6 | 1 in 156,411 |
| 4 | 5 + 1 bonus | 1 in 25,701 |
| 5 | 5 | 1 in 3,067 |
| 6 | 4 + 1 bonus | 1 in 894 |
| 7 | 4 | 1 in 167 |
| 8 | 3 + 1 bonus | 1 in 80 |
| Any prize | 1 in 50 |
Because Set for Life is drawn every night, a regular player enters far more draws than with a weekly game. That improves the chance of an eventual win, but it also multiplies the cost.
Work out your own odds
Choose a game, the number of standard games you play in each draw, and how many draws you’ll enter. The calculator shows your odds for every division per draw, your overall chance of Division 1 across all those draws, and the average wait.
Free tool
Lotto odds calculator
| Division | Winning numbers | Odds per game | Your odds per draw |
|---|
How systems and extra games change your odds
Every extra game is one more combination of numbers, and your odds improve in direct proportion: 10 games give 10 times the chance of 1 game. A system entry lets you mark more numbers than the game needs, and it covers every combination of them. It’s just a quick way to buy many games at once, and it costs the same as buying those games separately.
| Entry | Standard games covered | Division 1 odds |
|---|---|---|
| Saturday Lotto, 1 game | 1 | 1 in 8,145,060 |
| Saturday Lotto, System 7 | 7 | 1 in 1,163,580 |
| Saturday Lotto, System 8 | 28 | 1 in 290,895 |
| Powerball, 1 game | 1 | 1 in 134,490,400 |
| Powerball, System 8 | 8 | 1 in 16,811,300 |
| Powerball with every Powerball number (PowerHit-style) | 20 | 1 in 6,724,520 |
Worked example: a lotto syndicate
Ten workmates each put in money to buy 100 Saturday Lotto games for one draw. Their chance of Division 1 rises to about 1 in 81,450. If they win, the prize is split ten ways. A syndicate improves the odds for the group, but each person’s share of the expected return is the same as if they had spent their own money on their own games.
Lotto myths
| Myth | Reality |
|---|---|
| Some numbers are “due” | Every draw is independent. A number that hasn’t come up for months has the same chance as any other |
| Hot numbers are more likely | Past draws don’t change future ones |
| Consecutive numbers never win | 1, 2, 3, 4, 5, 6 has exactly the same chance as any other set of six. It’s just less popular |
| Quick Picks have worse odds | A random Quick Pick has the same odds as numbers you choose |
There is one thing that choosing numbers can change: how many people share a prize. Popular patterns, birthdays (numbers up to 31) and sequences are played by many people, so if they come up, the prize pool is split more ways. Picking less common numbers doesn’t help you win, but can mean a bigger share if you do.
Lotto compared with other games
Lotto is the longest-odds form of gambling most people play. For comparison, our keno odds guide shows a 10-spot keno jackpot is about 1 in 8.9 million, similar to Saturday Lotto’s Division 1. Casino games like European roulette have short odds and a small house edge, but none offer a life-changing prize from a small stake. Treat any lotto ticket as the price of a bit of fun, set a monthly amount, and stick to it. Our guide to setting gambling limits can help.
Sources
- The Lott: how to play Powerball
- The Lott: how to play Oz Lotto
- The Lott: how to play Saturday Lotto
- The Lott: how to play Set for Life
- Powerball (Australia)
- Gambling Help Online
Odds calculated by TWIN Journal from each game’s number matrix and rounded. Checked 19 November 2026.
Frequently asked questions
Which lotto has the best odds in Australia?
Saturday Lotto has the best Division 1 odds, about 1 in 8.1 million per game. Powerball has the best odds of winning any prize, about 1 in 44, but the worst Division 1 odds.
What are the odds of winning Powerball?
About 1 in 134.5 million per game for Division 1, which needs all 7 numbers and the Powerball. The odds of winning any prize are about 1 in 44.
What are the odds of winning Oz Lotto?
About 1 in 62.9 million per game for Division 1 (all 7 numbers). The odds of any prize are about 1 in 50.
What are the odds of winning Set for Life?
About 1 in 38.3 million per game for Division 1, which pays $20,000 a month for 20 years.
Do systems improve your odds?
Yes, but only because a system buys more games. A System 8 in Saturday Lotto covers 28 games, so it has 28 times the odds and costs about 28 times as much.
Are some lotto numbers luckier than others?
No. Every number has the same chance in every draw, whatever happened in previous draws.
Prefer games with a clear house edge?
Browse the casino games on TWIN. 18+ only, terms apply.
Gambling involves risk and outcomes are never guaranteed. Only play with money you can afford to lose. Free, confidential support is available 24/7 from Gambling Help Online on 1800 858 858.